When your Spring Boot application starts consuming an unusual amount of memory, it’s crucial to analyze the memory usage to identify potential issues and optimize performance. This guide will walk you through the process of taking a heap dump, downloading and installing Memory Analyzer (MAT) software, and analyzing the heap dump to identify memory leaks.
1. Taking a Heap Dump Using the jmap Command
First, we need to capture a snapshot of the application’s memory (heap dump) while it’s running. This can be achieved using the jmap command. Here’s the command to take a heap dump:
jmap -dump:live,format=b,file=heap_dump.hprof <pid>
Replace <PID> with the process ID of your running Spring Boot application. You can find the PID using commands like jps, ps, or tools like VisualVM or can use ps -eLf | grep tomcat8 to list all tomat proessers.
Example Screenshot:

2. Downloading the hprof File
After successfully creating the heap dump, download the heapdump.hprof file to your local machine for further analysis. You can transfer the file using SCP, SFTP, or any other preferred method.
3. Downloading and Installing Memory Analyzer (MAT) Software
Next, we need to install the Memory Analyzer Tool (MAT), an Eclipse-based tool for analyzing Java heap dumps.
Steps to Download and Install MAT:
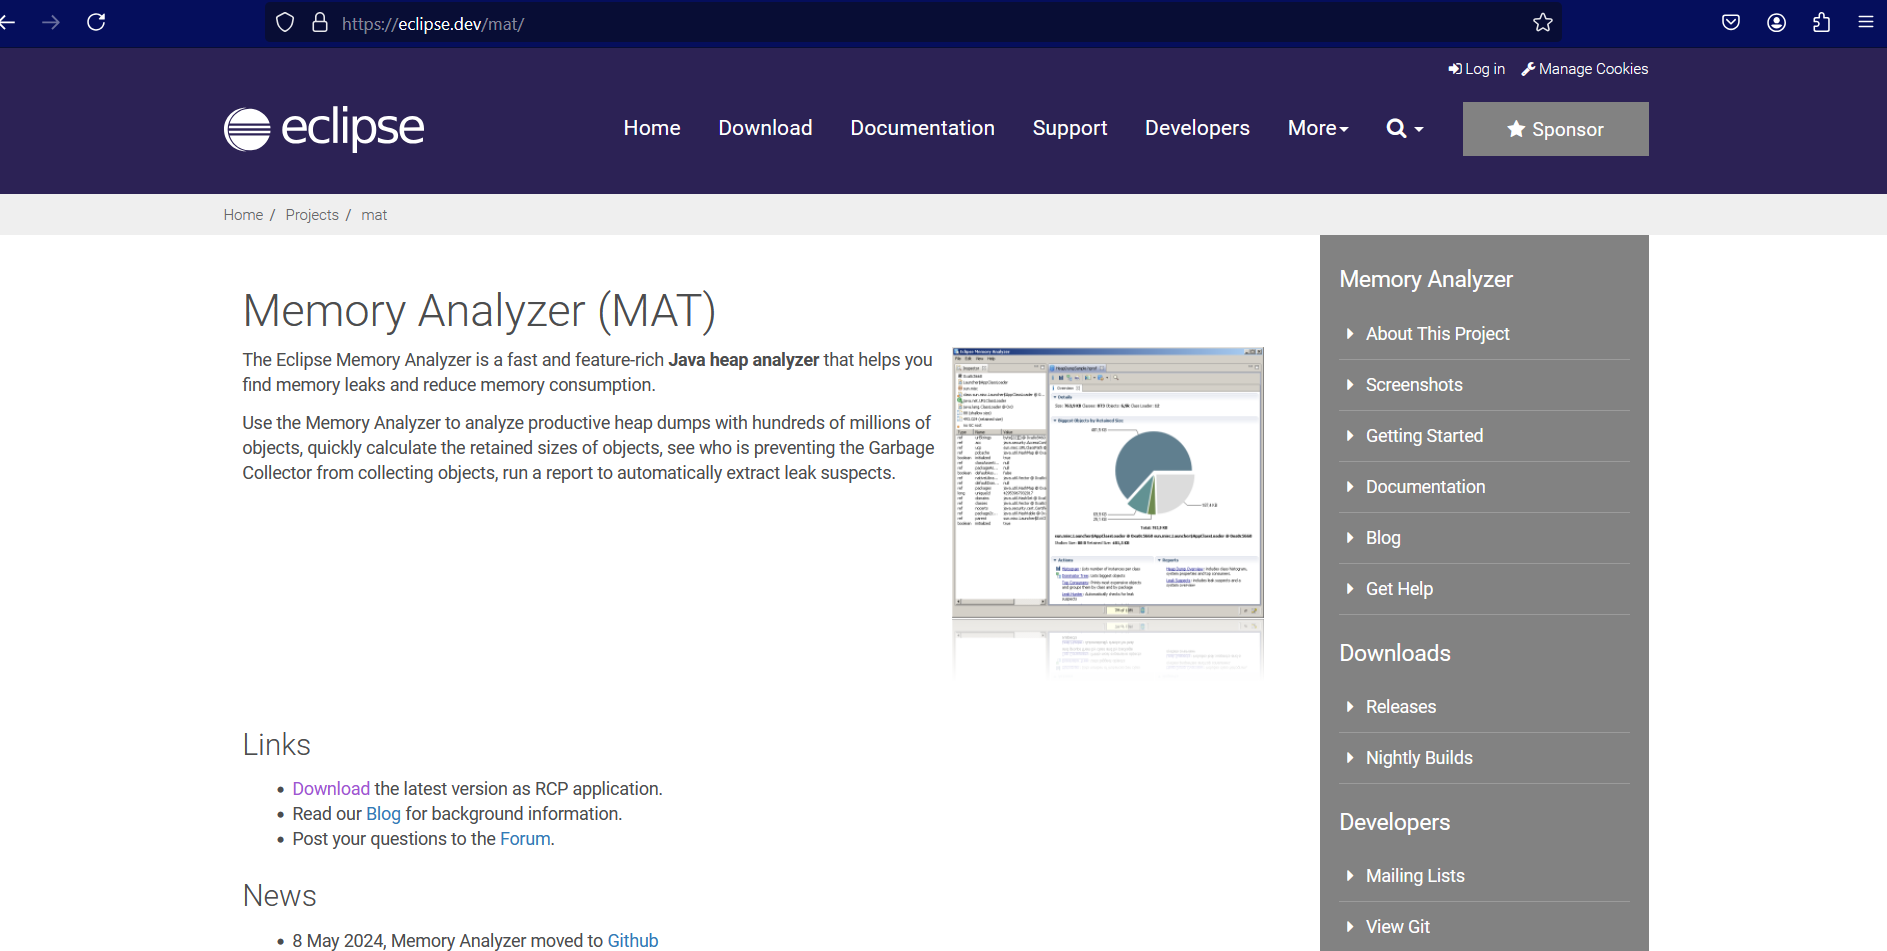
Download MAT: Visit the Memory Analyzer (MAT) download page and download the appropriate version for your operating system.
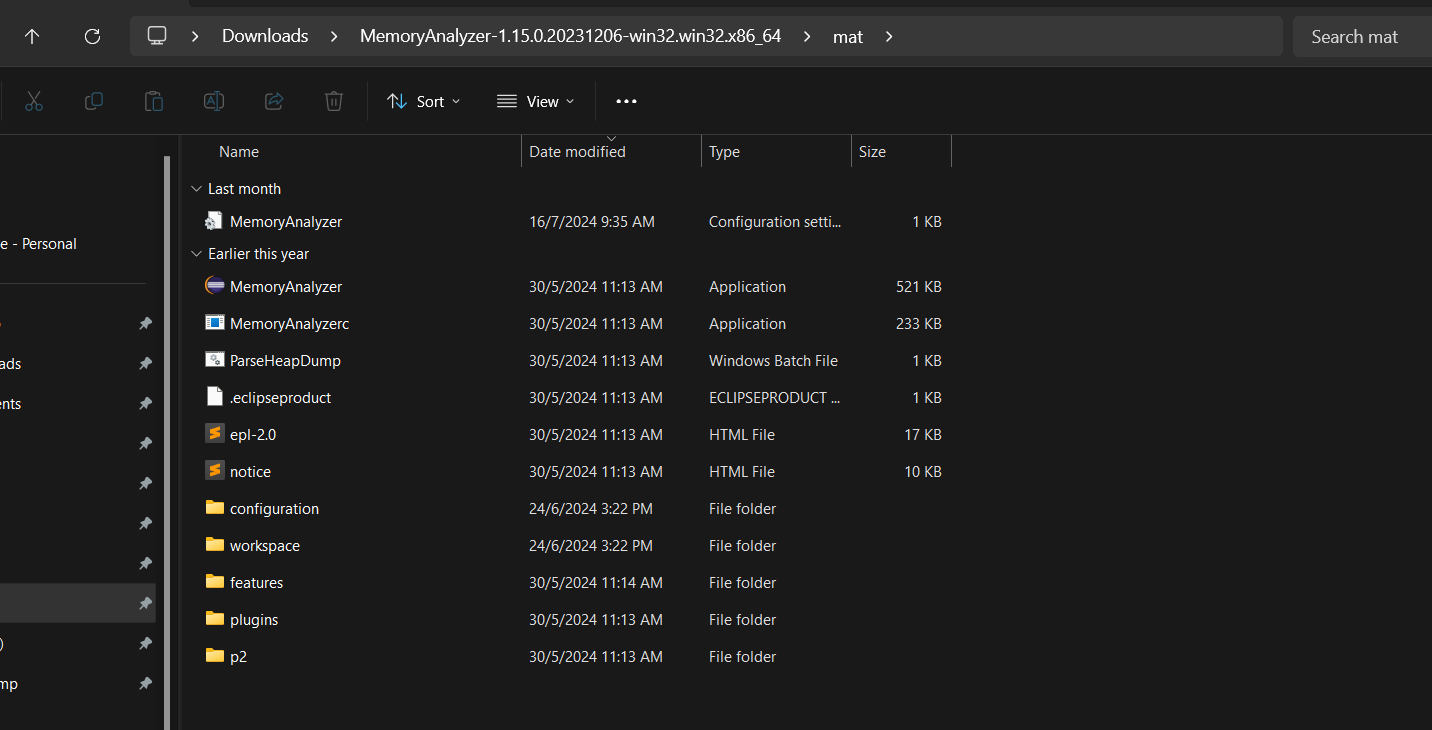
Install MAT: Follow the installation instructions for your specific operating system.
Example Screenshot:


4. Opening Memory Analyzer Software
Once MAT is installed or extrated, You can start the application by clicking the MemoryAnalyzer exe but if you have multiple java version installed at your machine, it is better to open the app using the following command where you can specify the java bin path for the correct version.
.\MemoryAnalyzer.exe -vm 'C:\Program Files\Java\jdk-22\bin'


5. Loading the Downloaded hprof File to Analyzer
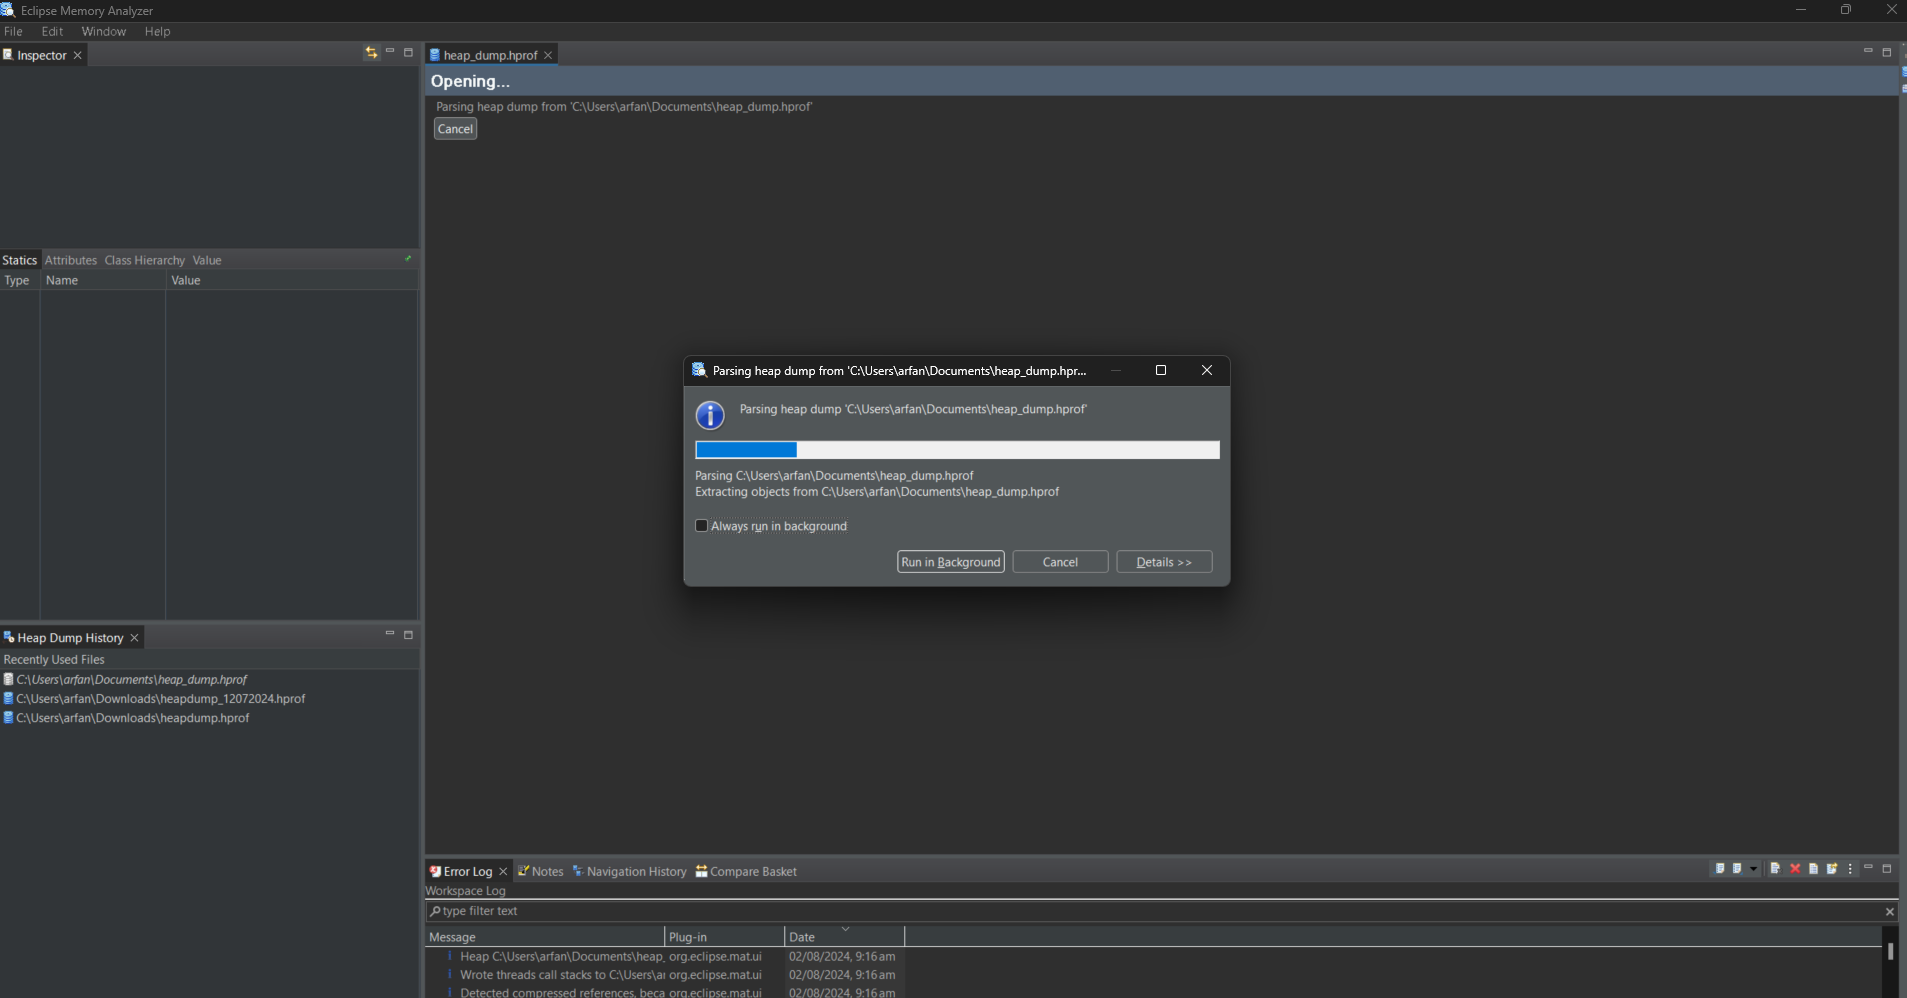
To analyze the heap dump, load the heapdump.hprof file into MAT.
Steps to Load the hprof File:
- Open File: In MAT, go to
File -> Open Heap Dumpand select theheapdump.hproffile you downloaded earlier. - Analyze: MAT will process the heap dump and generate various reports.
Example Screenshot:


6. Using and Understanding the Leak Suspect Report Chart
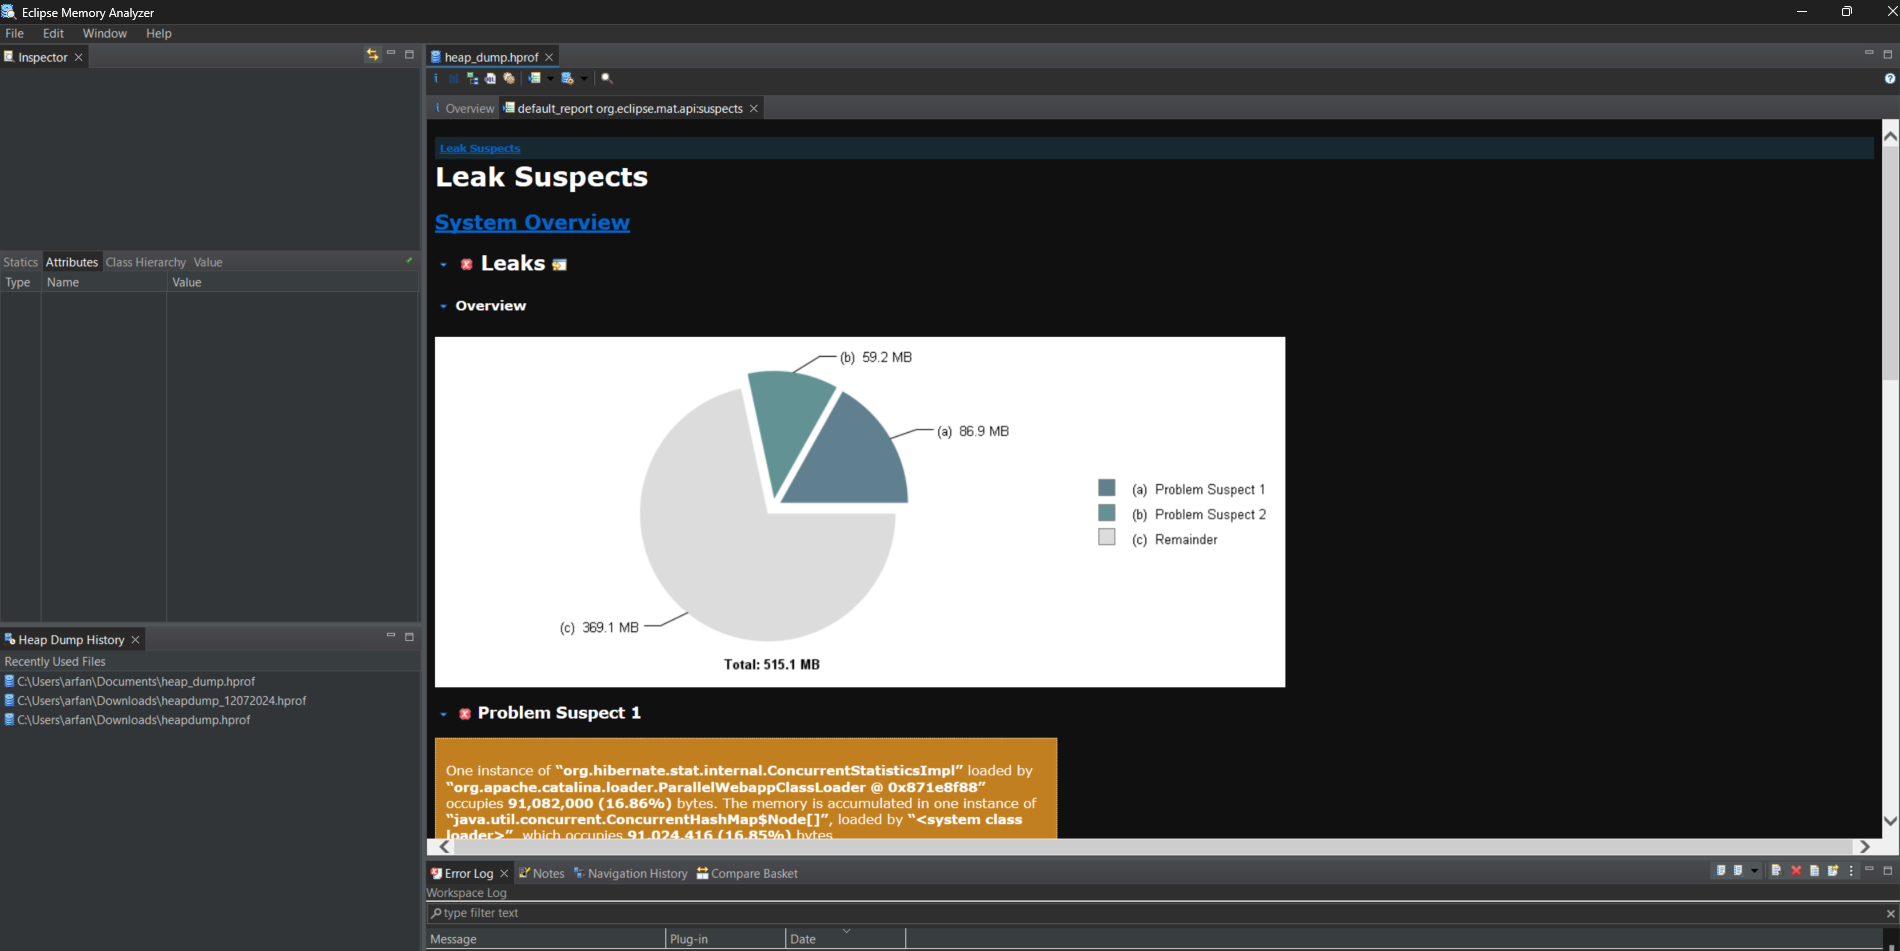
After loading the heap dump, MAT generates several reports. The Leak Suspect Report is particularly useful for identifying memory leaks.
Understanding the Leak Suspect Report:
- Overview: The report provides a summary of potential memory leaks.
- Leak Suspects: It lists objects that are retaining significant amounts of memory.
- Dominators: Shows which objects are dominating the heap, making it easier to identify memory leaks.
Example Screenshot:


By analyzing the Leak Suspect Report, you can pinpoint the objects or data structures that are consuming excessive memory. This helps in identifying and fixing memory leaks or inefficient memory usage in your Spring Boot application.
Conclusion
Analyzing memory consumption in a Spring Boot application involves capturing a heap dump, using tools like MAT to analyze the dump, and interpreting the reports to identify issues. By following these steps, you can effectively diagnose and address memory-related problems, ensuring optimal performance of your application.